




Vital signs are measured values that record important bodily functions. The most important vital signs in ALS are respiration and nutrition – measured by the body mass index, the vital capacity of the lungs and the peak cough. These vital signs provide important information for nutrition and ventilation therapy in ALS. In the ALS app, the values are displayed over time as a diagram and table in the “My vital signs” section. The values can be entered via your ALS app or your patient account in the outpatient partner care portal. The values can be entered by yourself, by the treatment team in your ALS outpatient clinic or via our data management system.
Body size
Body size is required to determine the body mass index (BMI). The BMI can be used to estimate nutritional requirements and provide suitable nutritional products.
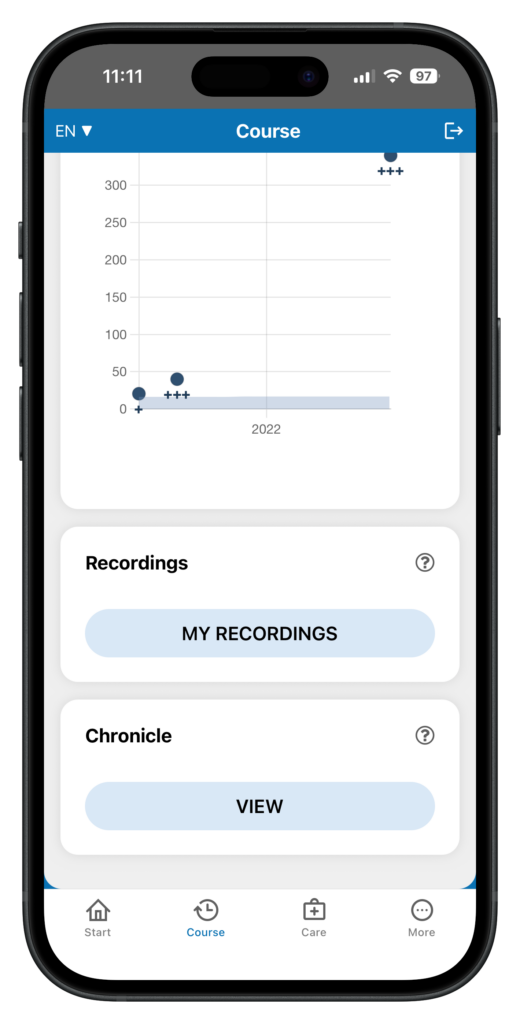
My vital signs
On the `Course´ page, you will find the `My Recordings´ section. The vital signs display the data for height, body weight, body mass index (BMI), vital capacity of the lungs and peak cough in chronological order.
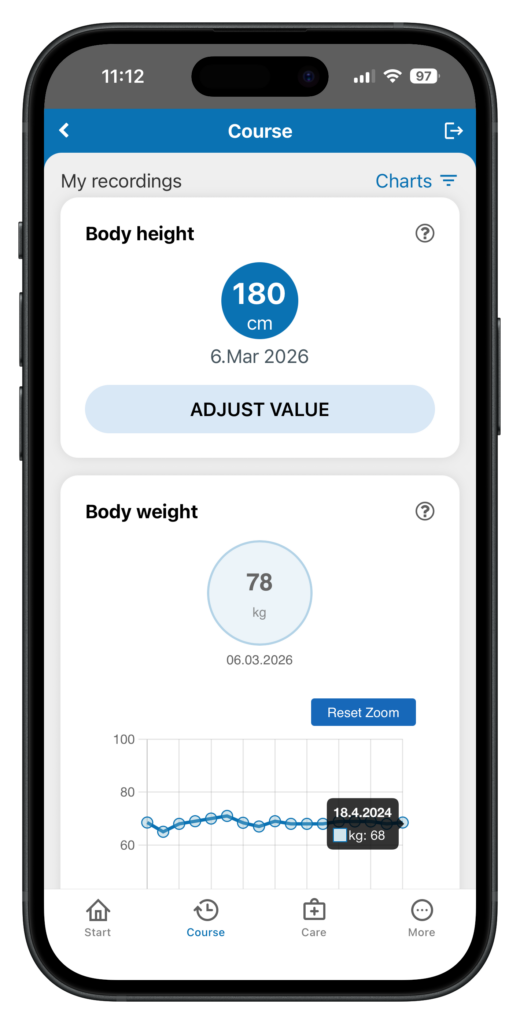
Body size
The current body height is displayed in the vital signs.
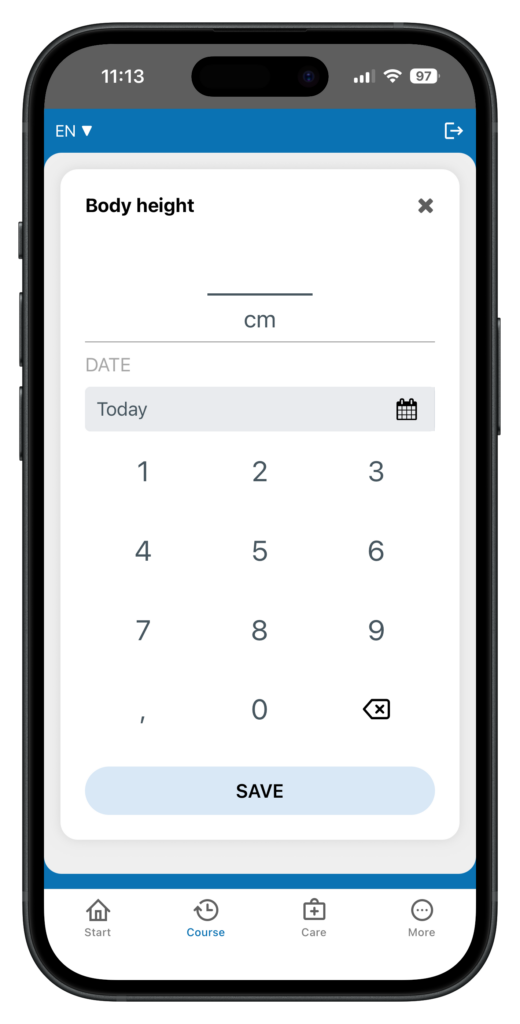
Enter your current height
Click on the ‘Adjust value’ button to open the input mask for the current body height
Body Weight
Unwanted weight loss affects more than 50% of people with ALS. Weight loss can have various causes. A swallowing disorder with reduced food intake, an increased energy requirement due to respiratory dysfunction or an ALS-associated metabolic disorder can cause unwanted weight loss.
Weight loss is important for the course of the disease, as malnutrition and undernourishment can be associated with a reduced quality of life and a shortened lifespan. In the ALS app, body weight is displayed as a vital value over time.
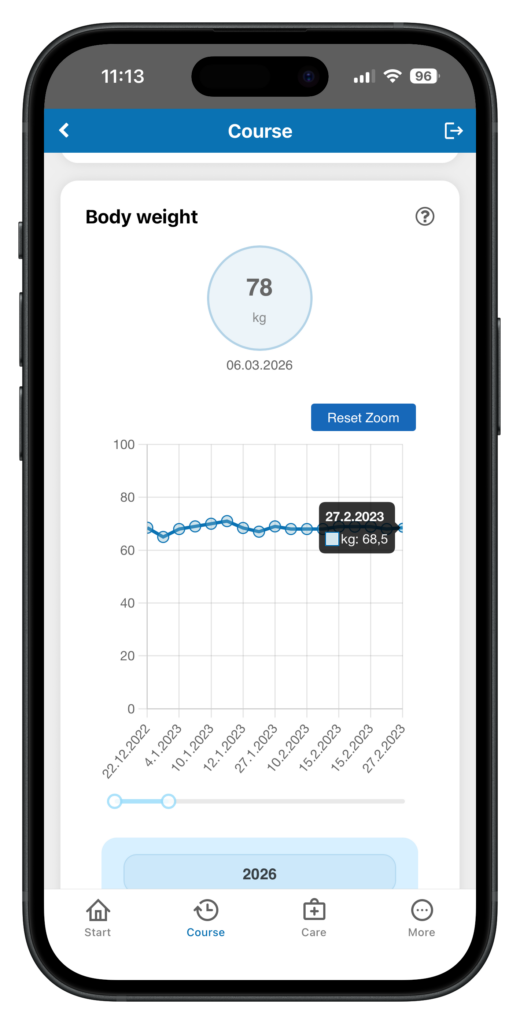
Body weight progression
On the My vital signs page you will find the development of your body weight over time in the form of a progression diagram.
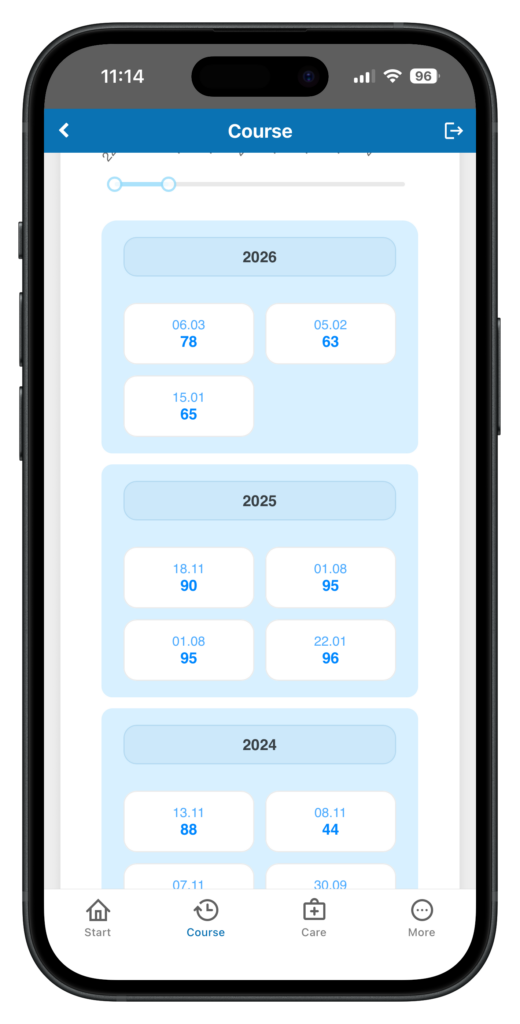
Body weight in a table
A selection menu in the top right-hand corner allows you to display the body weight over time as a diagram or table.
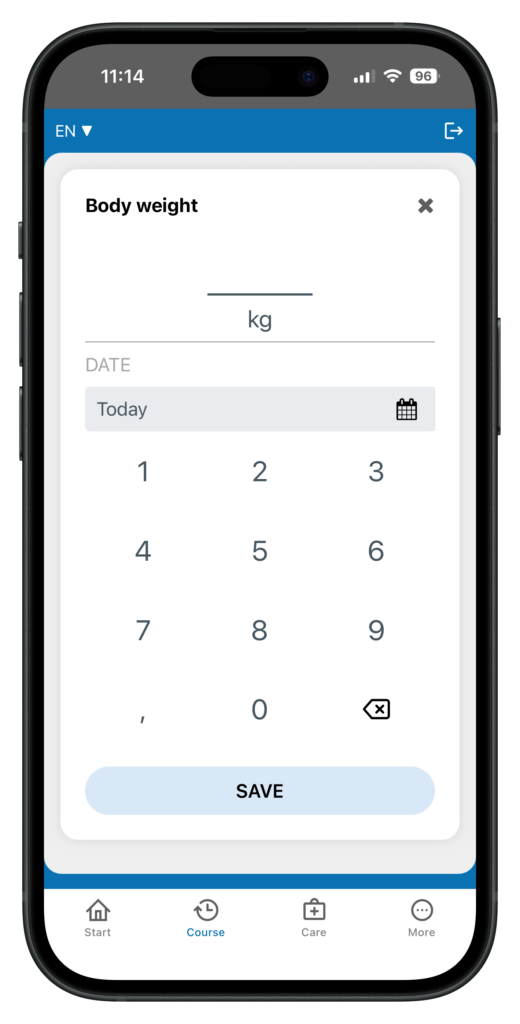
Enter the current body weight
Click on the ‘Add value’ button to open the input mask for the current body weight
Body mass index (BMI)
Weight loss has a prognostic significance in ALS and should be prevented or effectively treated through optimal nutritional care. Body weight and height are important when calculating energy requirements. The relationship between body weight and height is determined in the so-called body mass index (BMI). The BMI is calculated as body weight in kg/(height in meters)². A BMI below 18.5 kg/m2 is considered underweight and in need of treatment. In the ALS app, the BMI is calculated and the development over time is displayed in the vital signs.
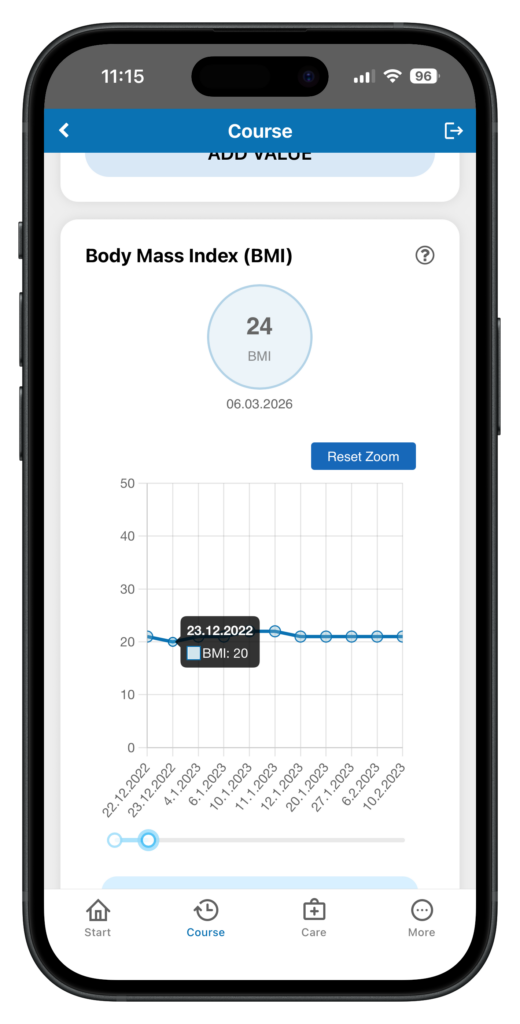
Development of the BMI
On the My Vital Signs page you will find the development of your BMI over time in the form of a progression chart.
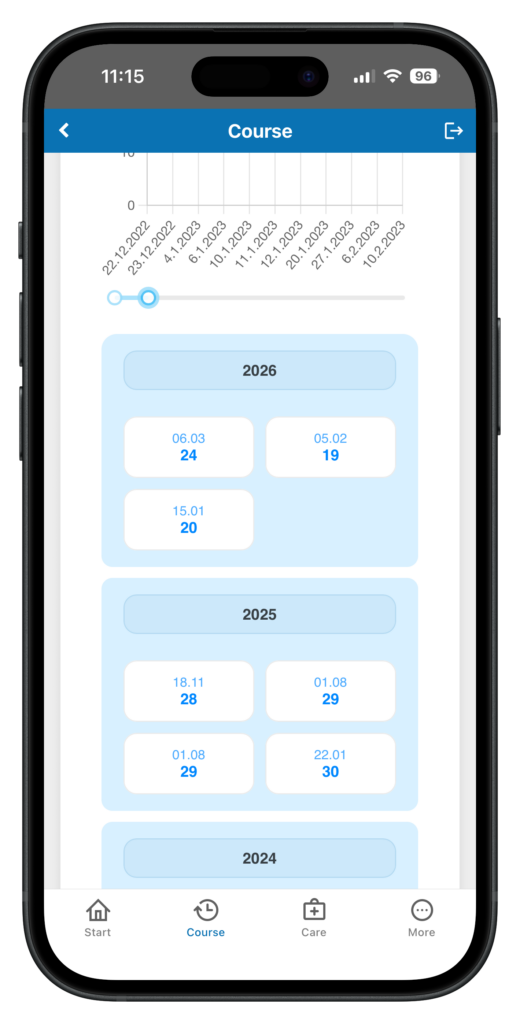
BMI in a table
A selection menu in the top right-hand corner allows you to display the progression of the BMI over time as a diagram or table.
Vital capacity of the lungs
Vital capacity (VC) is a parameter used in lung function diagnostics. A reduced respiratory capacity can be determined by the VK respiratory test. The VK measurement is a key value that is regularly determined in ALS outpatient clinics and used as a basis for deciding on possible treatment measures. VC can be measured in different ways: by breathing in and out quickly (FVC, forced vital capacity) or by breathing in and out slowly (SVC, slow vital capacity). The SVC value is displayed in the ALS app.
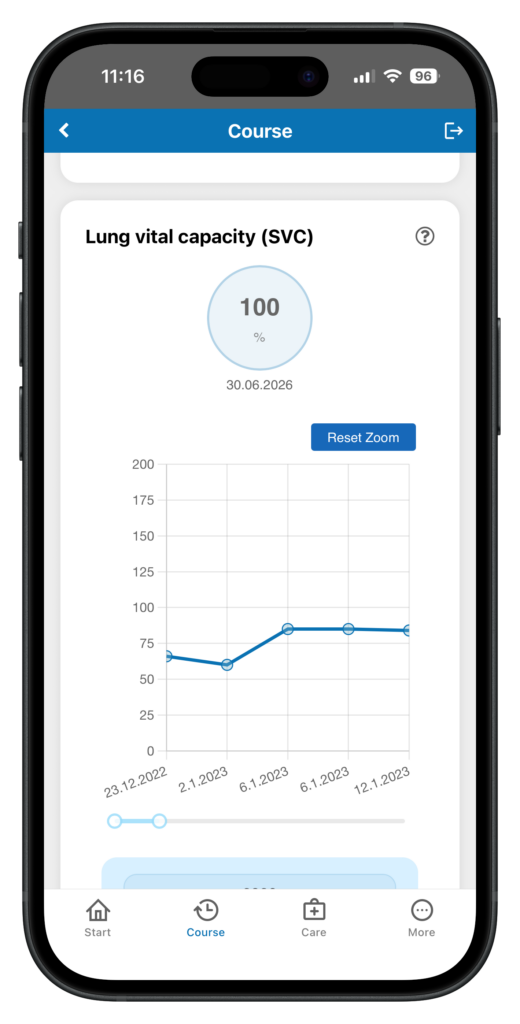
Course of the vital capacity
On the My vital signs page you will find the development of the vital capacity of the lungs over time in the form of a progression diagram.
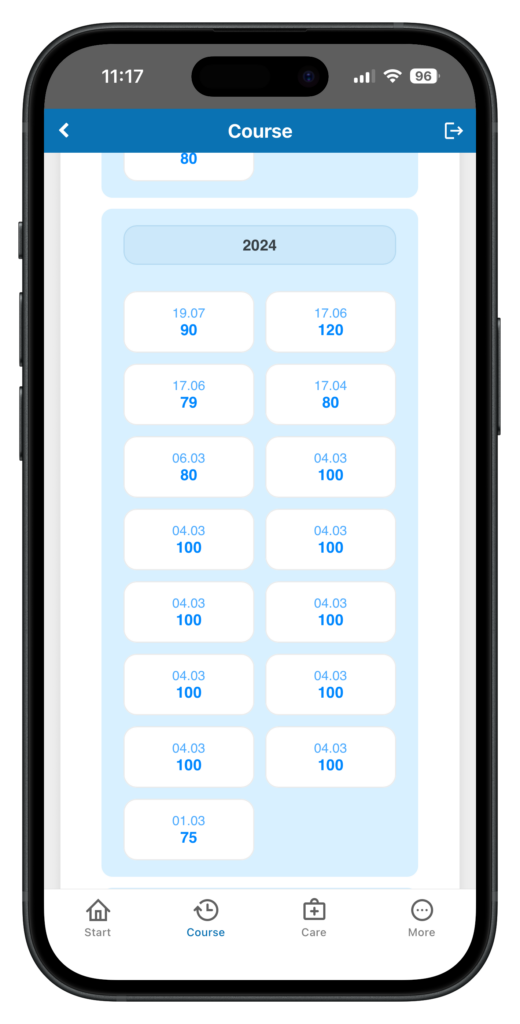
Course of the vital capacity in a table
A selection menu in the top right-hand corner allows the vital capacity of the lungs to be displayed over time as a diagram or table.
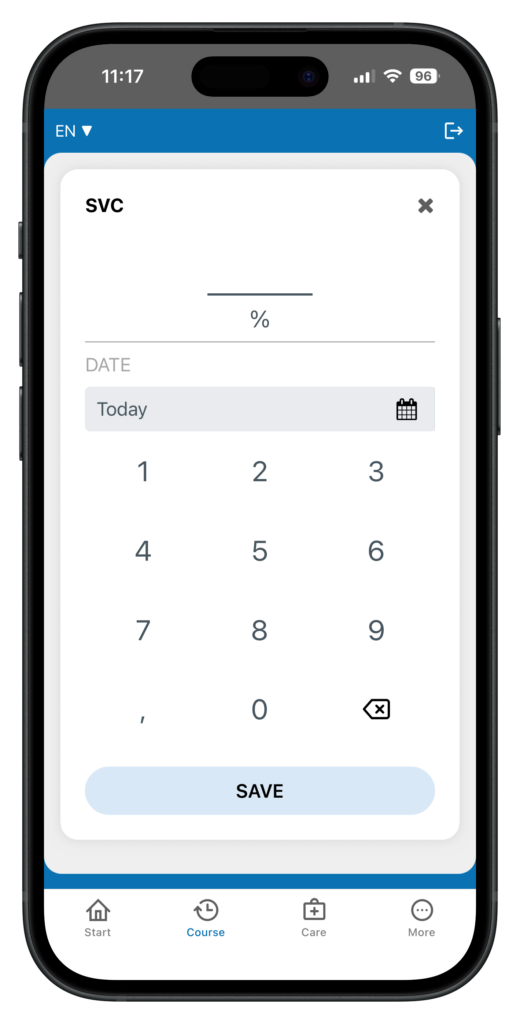
Enter the current vital capacity
Click on the ‘Add value’ button to open the input screen for the current value of the vital capacity.
Peak cough flow (PCF)
ALS can lead to impairment of the respiratory muscles. This can also be associated with a weak cough. The weakness of the cough manifests itself in a reduction in the “coughing thrust”. The intensity of the cough can be determined by measuring the peak cough flow (PCF). The peak cough indicates the maximum exhalation rate during a cough. It is normally above 270 l/min in adults.
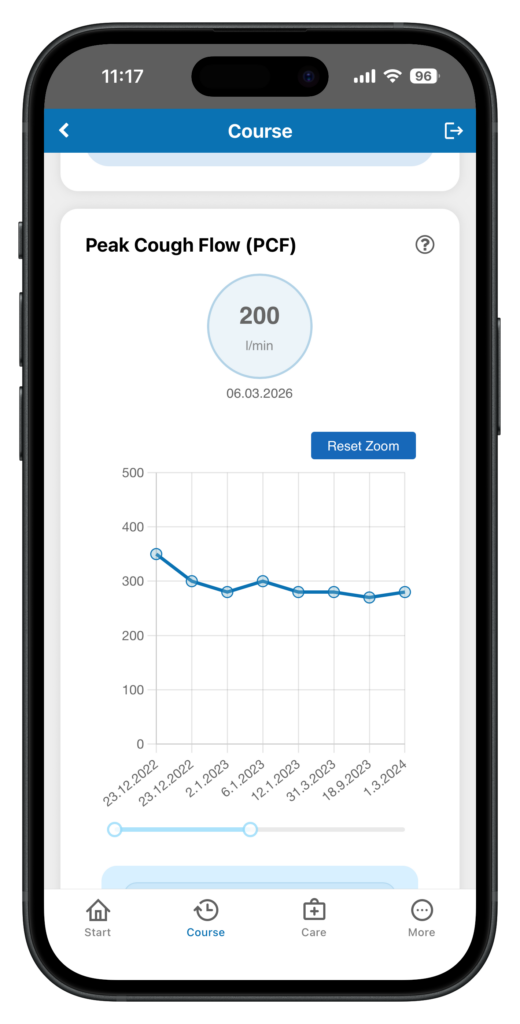
Course of the coughing spike
On the My vital signs page, you will find the progression of the cough peak values over time in the form of a progression diagram.
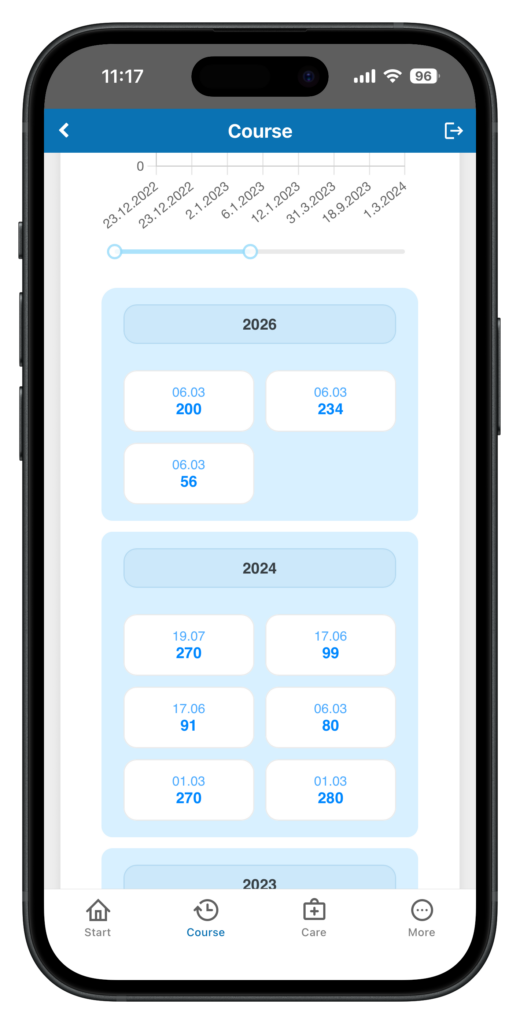
Course of the values of the cough peak impact in a table
A selection menu in the top right-hand corner allows you to display the time course of the cough peak as a diagram or table.
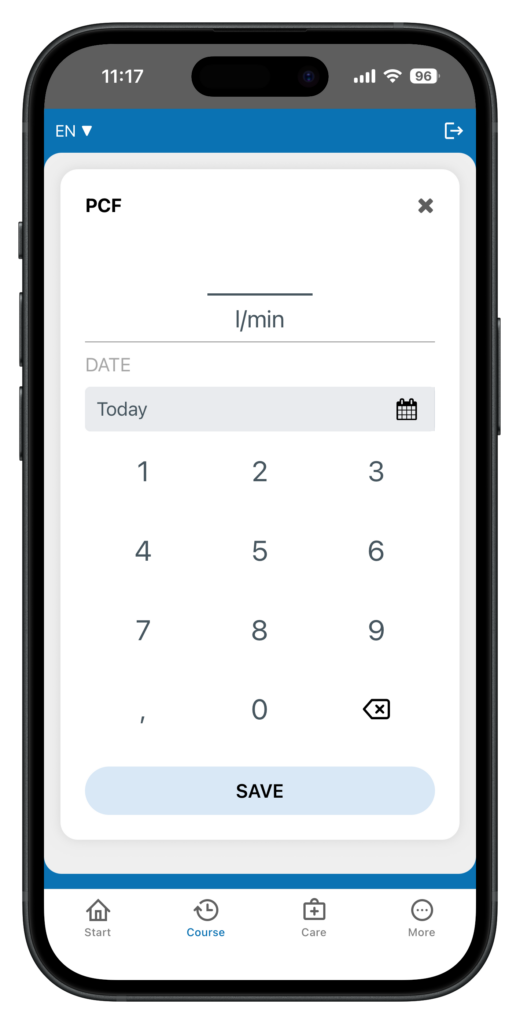
Enter the current value of the cough peak impact
Click on the ‘Add value’ button to open the input mask for the current value of the cough peak impact.